Contact a librarian for help
• Research desk: (314) 246-6950 • Toll-free: (800) 985-4279 • Click here to Ask a Librarian page
In regular conversation, both words are often used interchangeably. In the world of libraries, academia and research there is an important distinction between data and statistics. Data is the raw information from which statistics are created. Put in the reverse, statistics provide an interpretation and summary of data.
If you’re looking for a quick number, you want a statistic. A statistic will answer “how much” or “how many”. A statistic repeats a pre-defined observation about reality.
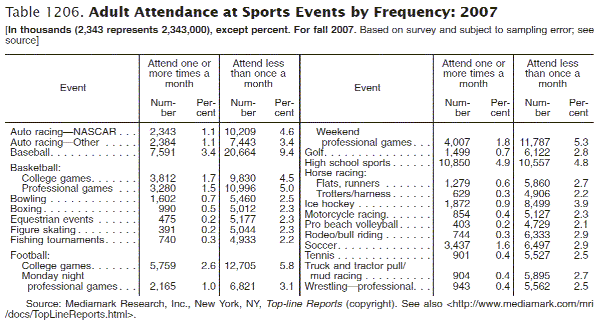
Statistics are the results of data analysis. It usually comes in the form of a table or chart. This is what a statistical table looks like:

Source:
If you want to understand a phenomenon, you want data. Data can be analyzed and interpreted using statistical procedures to answer “why” or “how.” Data is used to create new information and knowledge.
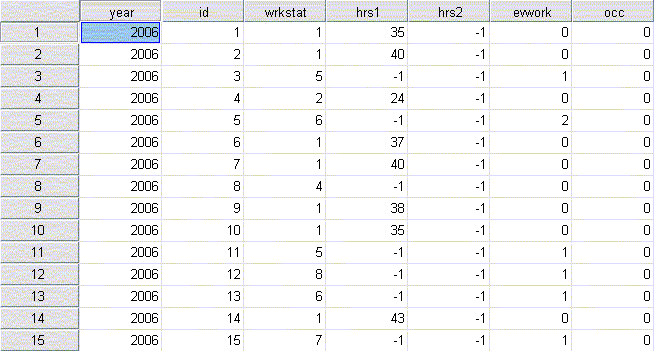
Raw data is the direct result of research that was conducted as part of a study or survey. It is a primary source. It usually comes in the form of a digital data set that can be analyzed using software such as Excel, SPSS, SAS, and so on. This is what a data set looks like:


